Plots.jl
Plots.jl and Makie.jl functions mostly work out of the box on AbstractDimArray, although not with the same results - they choose to follow each packages default behaviour as much as possible.
This will plot a line plot with 'a', 'b' and 'c' in the legend, and values 1-10 on the labelled X axis:
Plots.jl support is deprecated, as development is moving to Makie.jl
Makie.jl
Makie.jl functions also mostly work with AbstractDimArray and will permute and reorder axes into the right places, especially if X/Y/Z/Ti dimensions are used.
In makie a DimMatrix will plot as a heatmap by default, but it will have labels and axes in the right places:
using DimensionalData, CairoMakie

A = rand(X(10:10:100), Y([:a, :b, :c]))
Makie.plot(A; colormap=:inferno)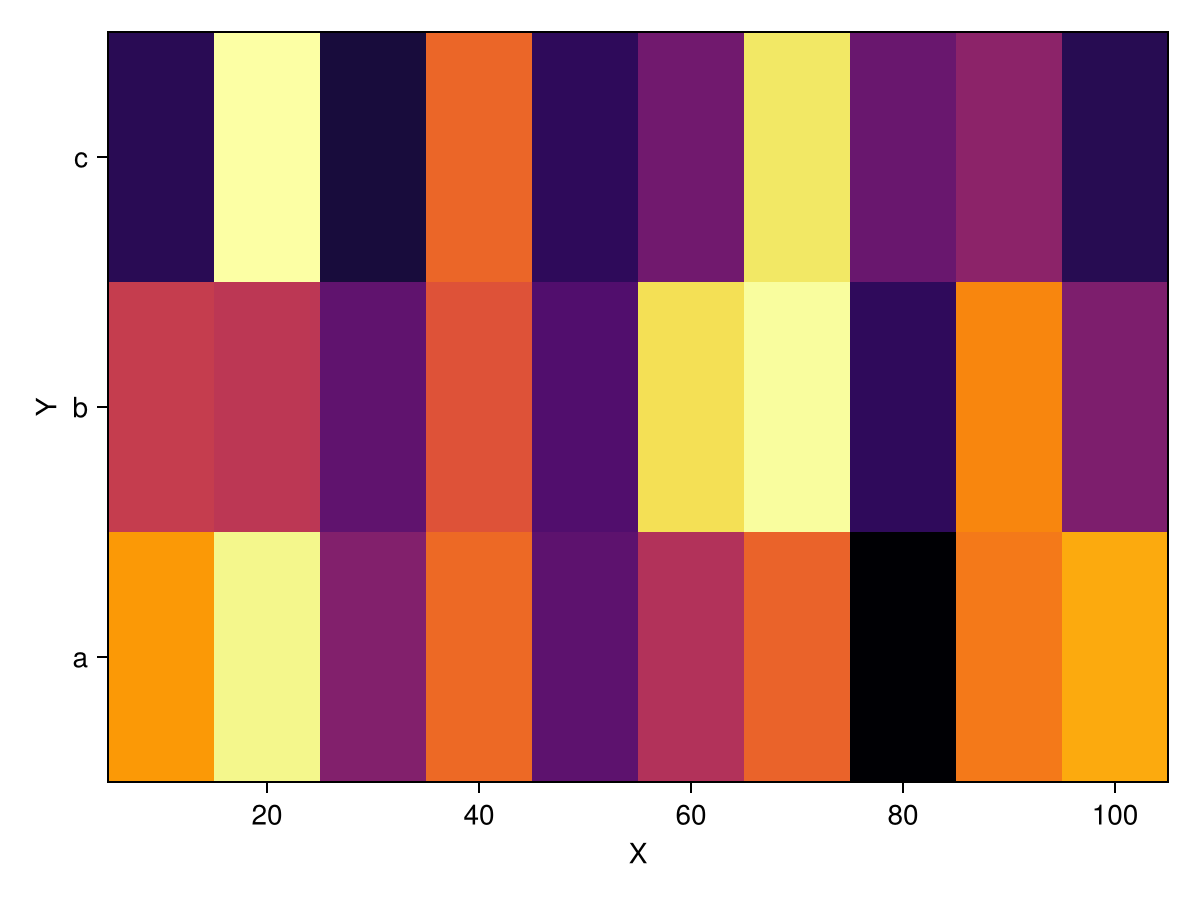
Other plots also work, here DD ignores the axis order and instead favours the categorical varable for the X axis:
Makie.rainclouds(A)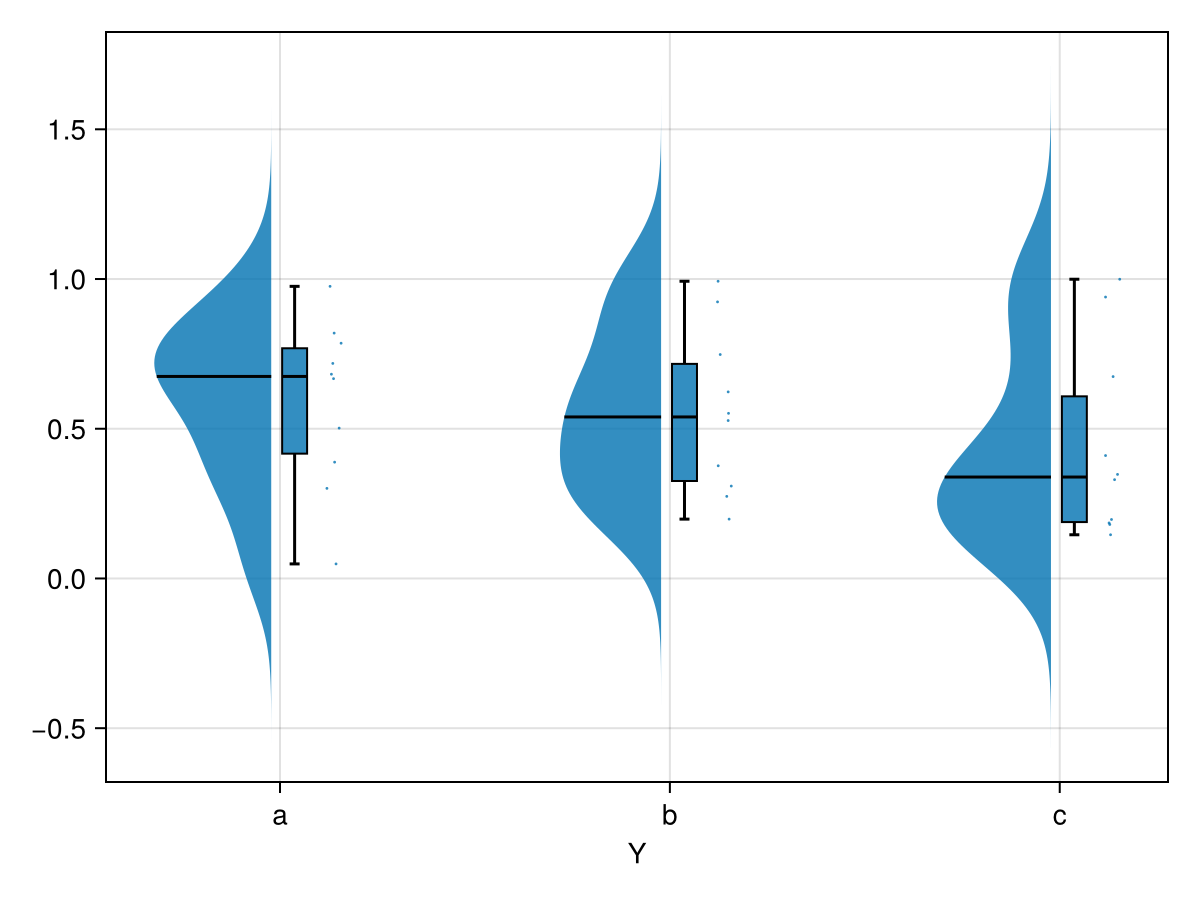
Test series plots
default colormap
B = rand(X(10:10:100), Y([:a, :b, :c, :d, :e, :f, :g, :h, :i, :j]))
Makie.series(B)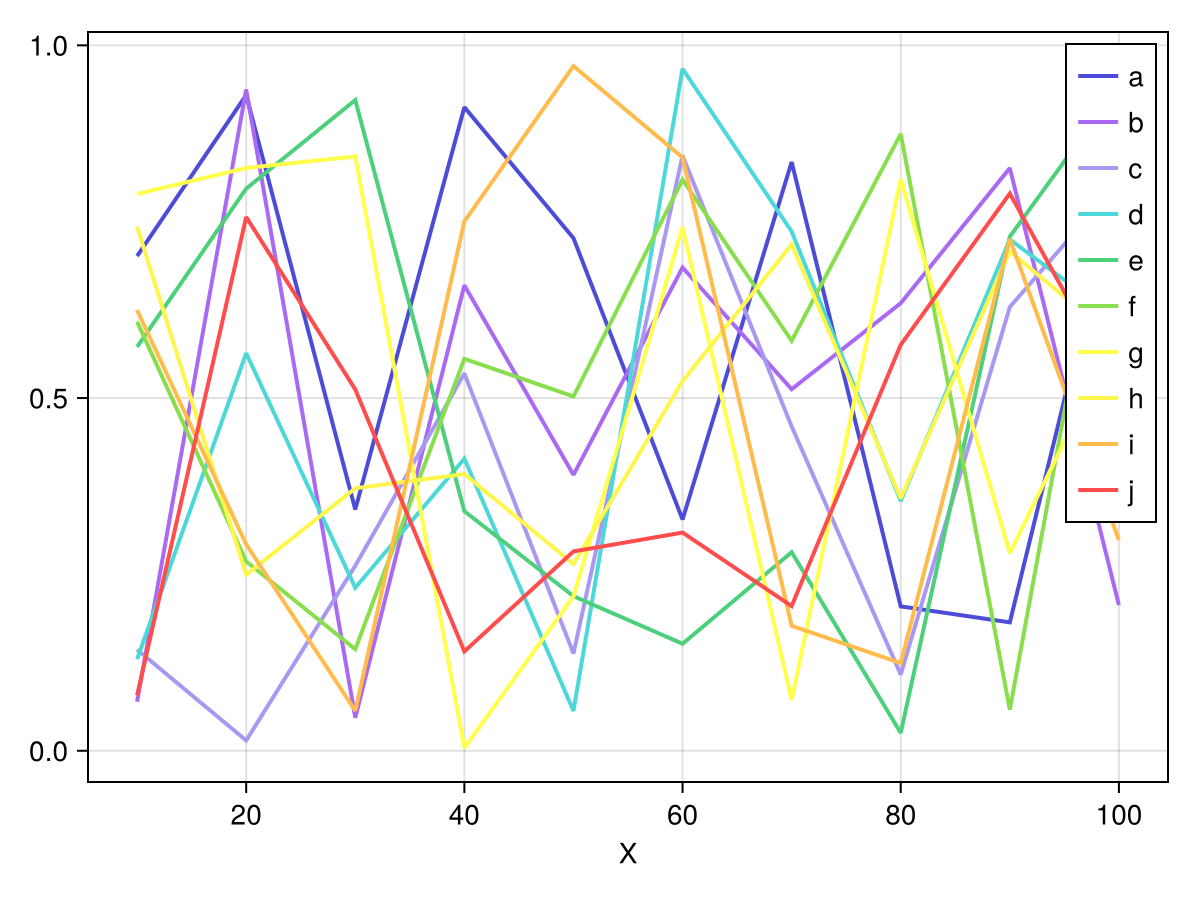
A different colormap
The colormap is controlled by the color argument, which can take as an input a named colormap, i.e. :plasma or a list of colours.
Makie.series(B; color=:plasma)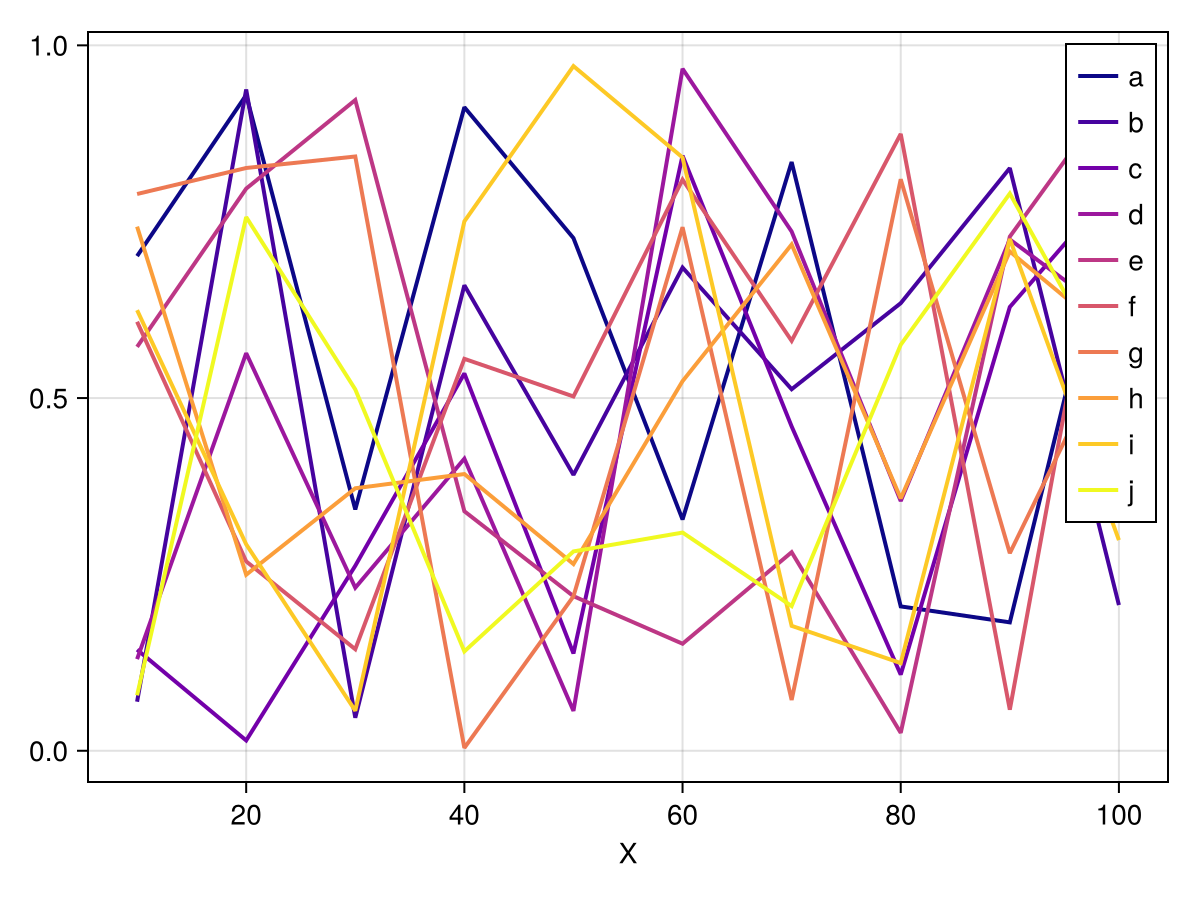
Makie.series(A; color=[:red, :blue, :orange])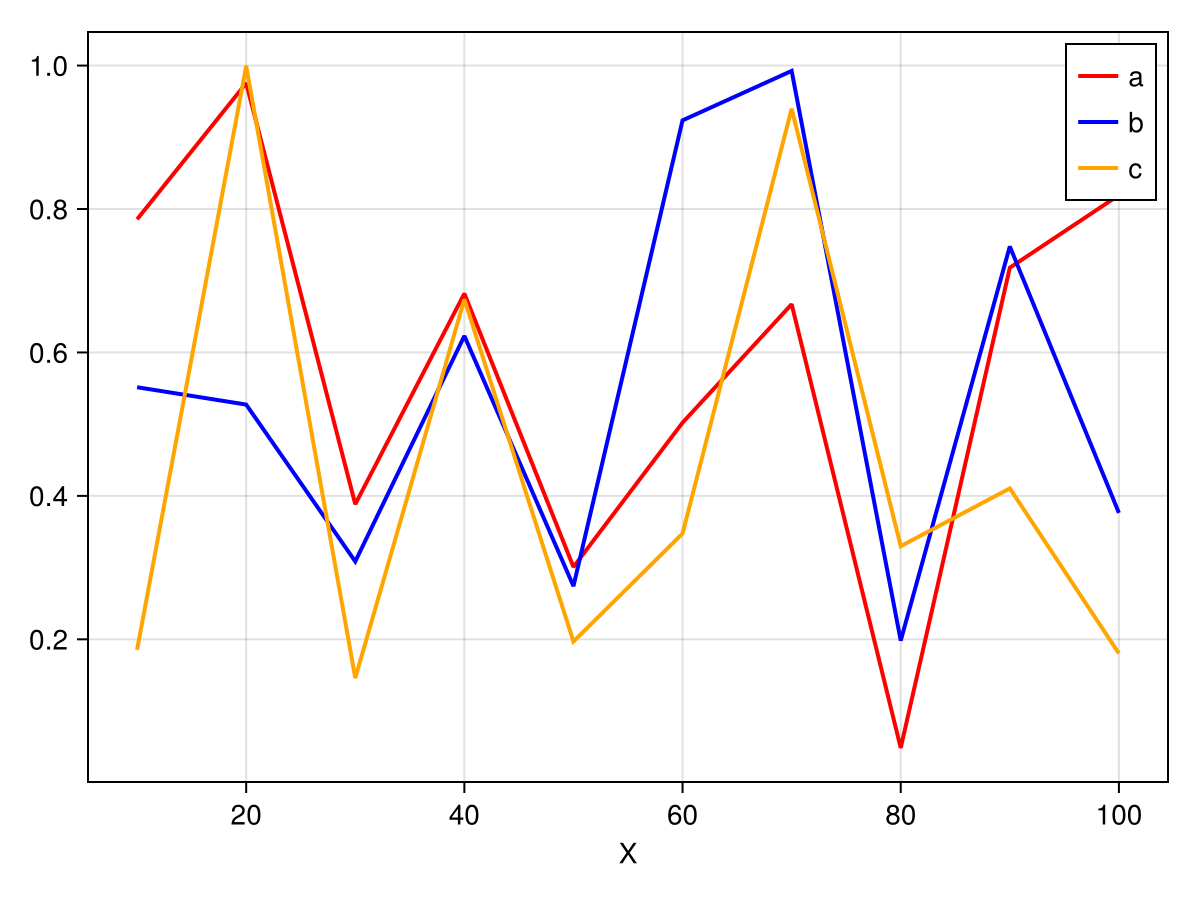
with markers
Makie.series(A; color=[:red, :blue, :orange], markersize=15)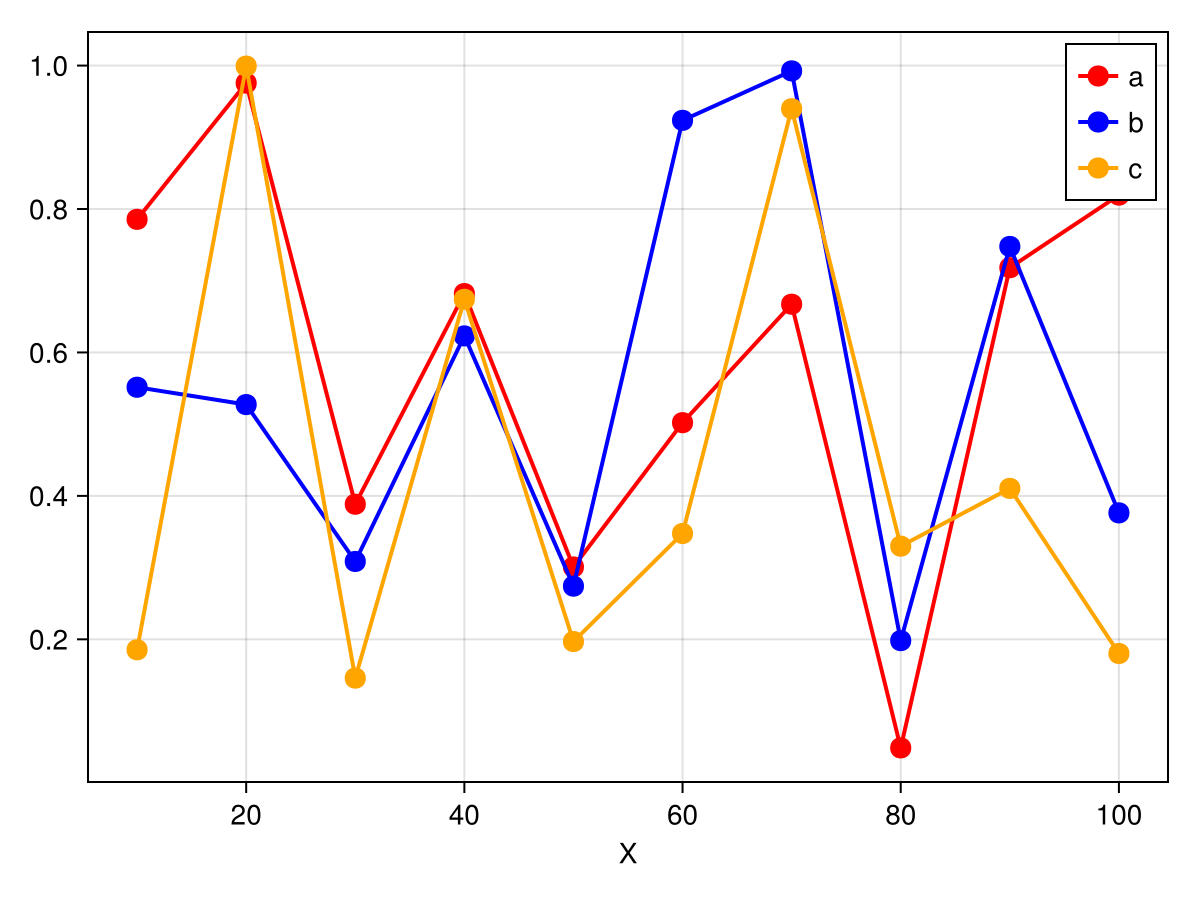
A lot more is planned for Makie.jl plots in future!