Rasterize with crazy things
A benefit of being written in pure Julia is that you can do anything you want with rasterize - you can rasterize to any type or combination of types that you can get to work.
Let's take an example. Say you want to rasterize all the countries in the world, but where two countries overlap, you want to save the indices of both countries.
A simple way to do this is to have each pixel of the raster actually be an array of integers, which stores the index of each geometry that touches the pixel.
Setup
Install the packages used in this tutorial:
using Pkg
Pkg.add(["NaturalEarth", "CairoMakie", "Rasters"])
Now, let's get some data. This is a feature collection of all countries in the world.
using NaturalEarth: naturalearth
using CairoMakie # plotting

countries = naturalearth("admin_0_countries", 10)
poly(countries.geometry; strokewidth = 1)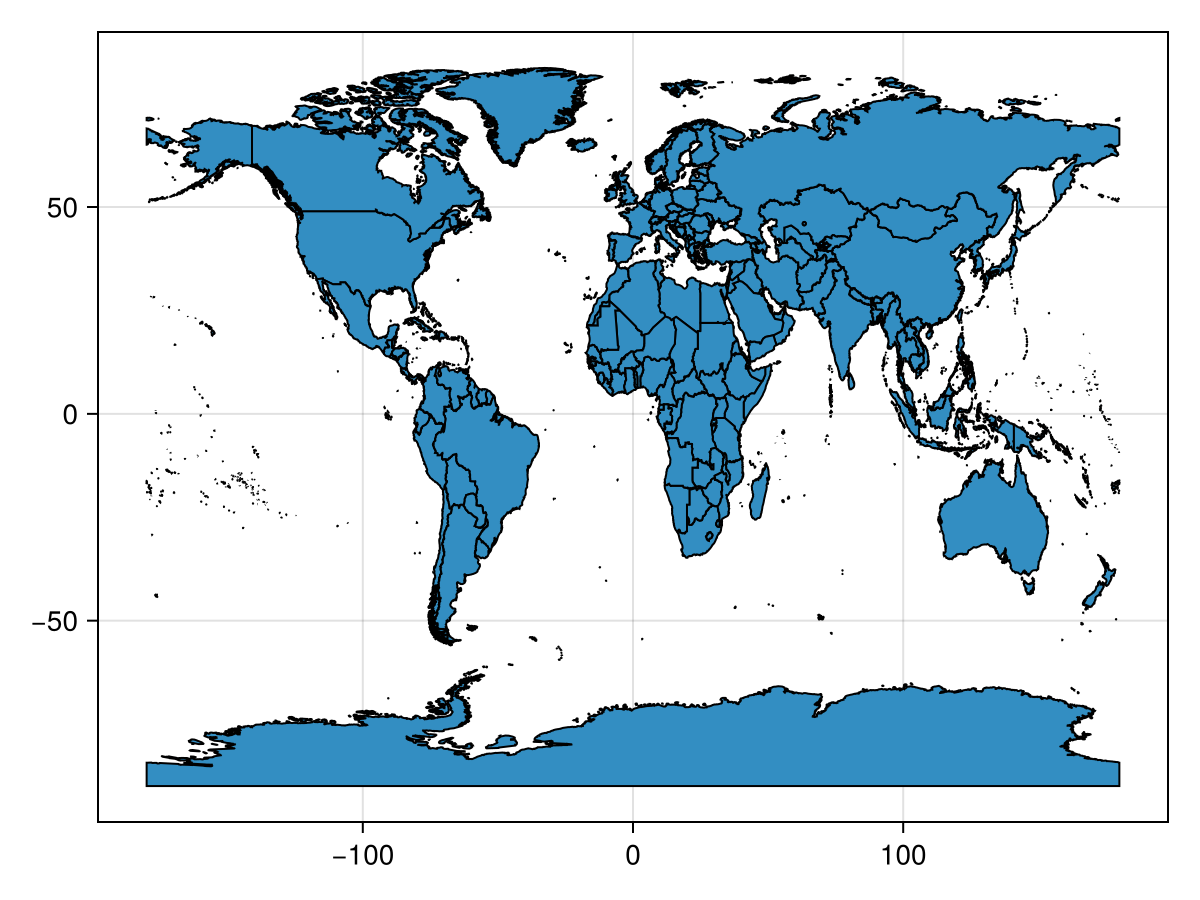
Next, we can rasterize it. Note that if you're going beyond the standard datatypes like Int, Float64, etc., you will need to specify some extra kwargs to rasterize, so Rasters doesn't have to guess what you want.
using Rasters

ras = rasterize(
    countries;
    op = vcat,
    fill = [[i] for i in 1:length(countries.geometry)], # By default a Vector with just the current country id
    boundary = :touches, # this one is just for the plot to look good
    res = 0.5, # half-degree resolutoin
    # Below are the kwargs you have to provide if using a
    # custom type that might not have e.g. `zero` defined
    eltype = Vector{Int},
    missingval = Int[], # empty vector of Int
    init = Int[],       # empty vector of Int
)
┌ 721×348 Raster{Vector{Int64}, 2} nothing ┐
├──────────────────────────────────────────┴───────────────────────────── dims ┐
↓ X Sampled{Float64} -180.0:0.5:180.0 ForwardOrdered Regular Intervals{Start},
→ Y Sampled{Float64} -90.0:0.5:83.5 ForwardOrdered Regular Intervals{Start}
├──────────────────────────────────────────────────────────────────── metadata ┤
Metadata of Dict{Any, Any} with 1 entry:
"missed_geometries" => Bool[0, 0, 0, 0, 0, 0, 0, 0, 0, 0 … 0, 0, 0, 0, 0, 0…
├────────────────────────────────────────────────────────────────────── raster ┤
missingval: Int64[]
extent: Extent(X = (-180.0, 180.5), Y = (-90.0, 84.0))
└──────────────────────────────────────────────────────────────────────────────┘
↓ → -90.0 -89.5 -89.0 … 81.0 81.5 82.0 82.5 83.0 83.5
-180.0 [176] [176] [176] [] [] [] [] [] []
-179.5 [176] [176] [176] [] [] [] [] [] []
⋮ ⋱ ⋮
179.5 [176] [176] [176] … [] [] [] [] [] []
180.0 [176] [176] [176] [] [] [] [] [] []You can also see that this has a lot of unique values:
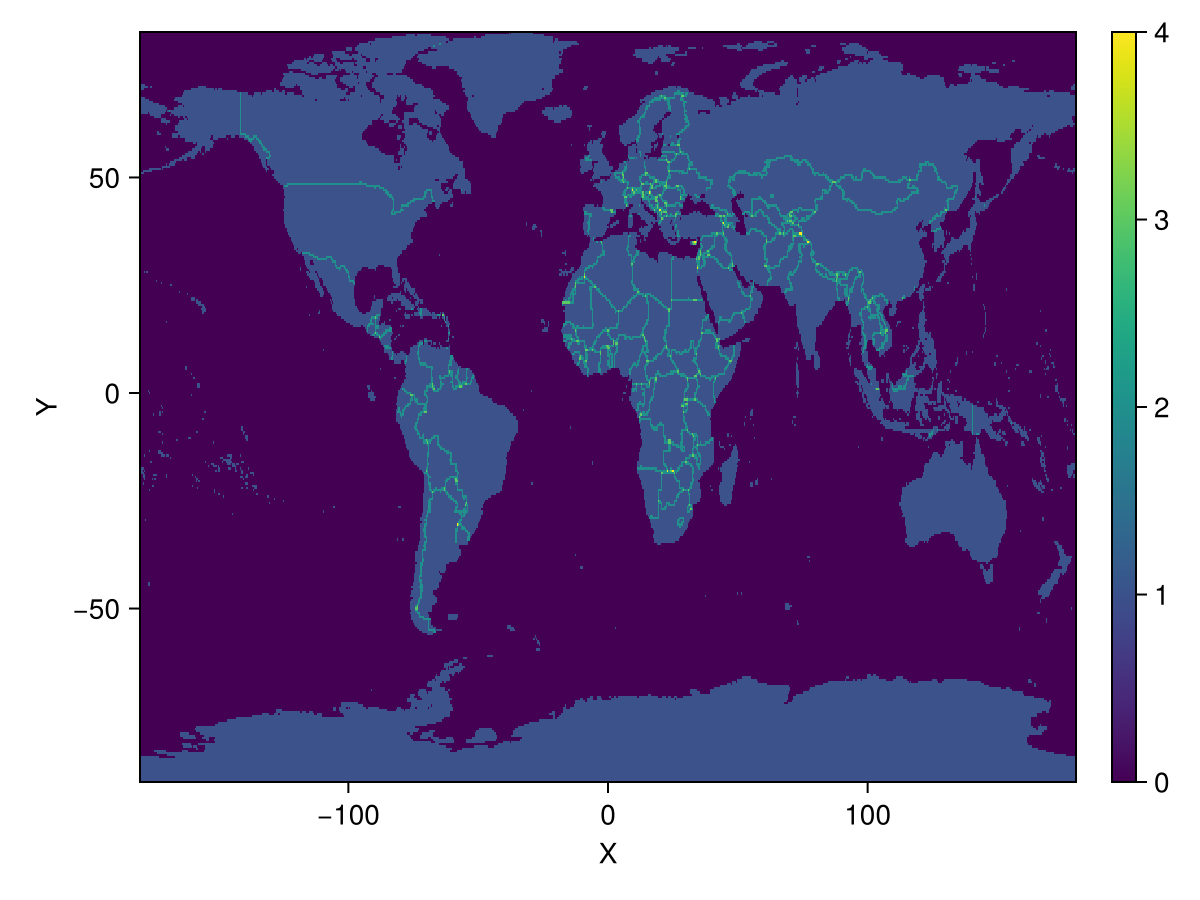
length(unique(ras))755It's clearest if you plot a heatmap of the lengths of each cell:
heatmap(length.(ras))