Load occurrences for the Mountain Pygmy Possum using GBIF.jl
Load GBIF
julia
using Rasters, GBIF2
using RasterDataSources
const RS = RastersRastersjulia
records = GBIF2.occurrence_search("Burramys parvus"; limit=300)300-element GBIF2.Table{GBIF2.Occurrence, JSON3.Array{JSON3.Object, Vector{UInt8}, SubArray{UInt64, 1, Vector{UInt64}, Tuple{UnitRange{Int64}}, true}}}┌──────────────────────────┬─────────┬─────────┬─────────┬──────────┬───────────
│ geometry │ year │ month │ day │ kingdom │ phylum ⋯
│ Tuple{Float64, Float64}? │ Int64? │ Int64? │ Int64? │ String? │ String? ⋯
├──────────────────────────┼─────────┼─────────┼─────────┼──────────┼───────────
│ missing │ 2021 │ 1 │ 6 │ Animalia │ Chordata ⋯
│ (148.391, -36.3036) │ 2015 │ 11 │ 15 │ Animalia │ Chordata ⋯
│ (148.333, -36.4333) │ 2011 │ 11 │ 21 │ Animalia │ Chordata ⋯
│ missing │ missing │ missing │ missing │ Animalia │ Chordata ⋯
│ (148.396, -36.3818) │ 2016 │ 11 │ 15 │ Animalia │ Chordata ⋯
│ (148.347, -36.5047) │ 2012 │ 11 │ 22 │ Animalia │ Chordata ⋯
│ missing │ missing │ missing │ missing │ Animalia │ Chordata ⋯
│ (148.329, -36.4317) │ 2016 │ 1 │ 3 │ Animalia │ Chordata ⋯
│ (147.096, -36.9357) │ 2020 │ 2 │ 10 │ Animalia │ Chordata ⋯
│ missing │ missing │ missing │ missing │ Animalia │ Chordata ⋯
│ missing │ missing │ missing │ missing │ Animalia │ Chordata ⋯
│ (148.241, -36.4001) │ 2011 │ 11 │ 18 │ Animalia │ Chordata ⋯
│ missing │ missing │ missing │ missing │ Animalia │ Chordata ⋯
│ (148.236, -36.5249) │ 2012 │ 11 │ 23 │ Animalia │ Chordata ⋯
│ (147.1, -37) │ 2008 │ missing │ missing │ Animalia │ Chordata ⋯
│ ⋮ │ ⋮ │ ⋮ │ ⋮ │ ⋮ │ ⋮ ⋱
└──────────────────────────┴─────────┴─────────┴─────────┴──────────┴───────────
78 columns and 285 rows omittedExtract coordinates
Extract the longitude/latitude value to a Vector of points (a Tuple counts as a (x, y) point in GeoInterface.jl):
julia
coords = [(r.decimalLongitude, r.decimalLatitude) for r in records if !ismissing(r.decimalLatitude)]256-element Vector{Tuple{Float64, Float64}}:
(148.391097, -36.30362)
(148.332969, -36.433349)
(148.396453, -36.381847)
(148.347186, -36.504673)
(148.328896, -36.431684)
(147.096394, -36.935687)
(148.240881, -36.400058)
(148.235596, -36.524924)
(147.1, -37.0)
(148.338776, -36.430986)
⋮
(148.391682, -36.373215)
(148.394749, -36.284565)
(148.333783, -36.432552)
(148.333783, -36.432552)
(148.377673, -36.418261)
(148.328025, -36.437709)
(148.398438, -36.382602)
(148.310064, -36.448374)
(148.259489, -36.490719)Get layer / Band
Get BioClim layers and subset to south-east Australia
julia
A = RasterStack(WorldClim{BioClim}, (1, 3, 7, 12))
se_aus = A[X(138 .. 155), Y(-40 .. -25), RS.Band(1)]
╭────────────────────╮
│ 102×89 RasterStack │
├────────────────────┴─────────────────────────────────────────────────── dims ┐
↓ X Projected{Float64} LinRange{Float64}(138.0, 154.83333333333331, 102) ForwardOrdered Regular Intervals{Start},
→ Y Projected{Float64} LinRange{Float64}(-25.16666666666667, -39.83333333333333, 89) ReverseOrdered Regular Intervals{Start}
├────────────────────────────────────────────────────────────────────── layers ┤
:bio1 eltype: Float32 dims: X, Y size: 102×89
:bio3 eltype: Float32 dims: X, Y size: 102×89
:bio7 eltype: Float32 dims: X, Y size: 102×89
:bio12 eltype: Float32 dims: X, Y size: 102×89
├────────────────────────────────────────────────────────────────────── raster ┤
extent: Extent(X = (138.0, 154.99999999999997), Y = (-39.83333333333333, -25.000000000000004))
missingval: -3.4f38
crs: GEOGCS["WGS 84",DATUM["WGS_1984",SPHEROID["WGS 84",6378137,298.257223563,AUTHORITY["EPSG","7030"]],AUTHORITY["EPSG","6326"]],PRIMEM["Greenwich",0,AUTHORITY["EPSG","8901"]],UNIT["degree",0.0174532925199433,AUTHORITY["EPSG","9122"]],AXIS["Latitude",NORTH],AXIS["Longitude",EAST],AUTHORITY["EPSG","4326"]]
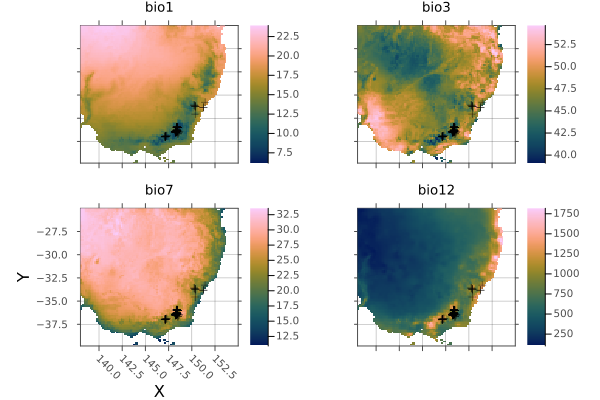
└──────────────────────────────────────────────────────────────────────────────┘Plot BioClim predictors and scatter occurrence points on all subplots
julia
using Plots
p = plot(se_aus);
kw = (legend=:none, opacity=0.5, markershape=:cross, markercolor=:black)
foreach(i -> scatter!(p, coords; subplot=i, kw...), 1:4)
p
Then extract predictor variables and write to CSV.
julia
using CSV
predictors = collect(extract(se_aus, coords))
CSV.write("burramys_parvus_predictors.csv", predictors)"burramys_parvus_predictors.csv"Or convert them to a DataFrame:
julia
using DataFrames
df = DataFrame(predictors)
df[1:5,:]