Species distribution modelling workflow
This example shows a full Species distribution modelling workflow, from loading data, to cleaning it, to fitting an ensemble and generating predictions.
It uses GBIF and WorldClim data, which are common datasets in ecology. We'll load occurrences for the Mountain Pygmy Possum species using GBIF2.jl, an interface to the Global Biodiversity Information Facility, and extract environmental variables using BioClim data from RasterDataSources.jl.
Load Rasters, ArchGDAL, RasterDataSources and GBIF
The GBIF2 library is used to download occurrence data, RasterDataSources to conveniently access Bioclim data. ArchGDAL is necessary to load in the Bioclim data.
using Rasters, GBIF2
using RasterDataSources, ArchGDAL
Load occurrences for the Mountain Pygmy Possum using GBIF.jl
records = GBIF2.occurrence_search("Burramys parvus"; limit=300)300-element GBIF2.Table{GBIF2.Occurrence, JSON3.Array{JSON3.Object, Vector{UInt8}, SubArray{UInt64, 1, Vector{UInt64}, Tuple{UnitRange{Int64}}, true}}}┌──────────────────────────┬─────────┬─────────┬─────────┬──────────┬───────────
│ geometry │ year │ month │ day │ kingdom │ phylum ⋯
│ Tuple{Float64, Float64}? │ Int64? │ Int64? │ Int64? │ String? │ String? ⋯
├──────────────────────────┼─────────┼─────────┼─────────┼──────────┼───────────
│ missing │ missing │ missing │ missing │ Animalia │ Chordata ⋯
│ missing │ 2021 │ 1 │ 6 │ Animalia │ Chordata ⋯
│ (148.391, -36.3036) │ 2015 │ 11 │ 15 │ Animalia │ Chordata ⋯
│ missing │ missing │ missing │ missing │ Animalia │ Chordata ⋯
│ (148.333, -36.4333) │ 2011 │ 11 │ 21 │ Animalia │ Chordata ⋯
│ (148.396, -36.3818) │ 2016 │ 11 │ 15 │ Animalia │ Chordata ⋯
│ missing │ missing │ missing │ missing │ Animalia │ Chordata ⋯
│ (147.096, -36.9357) │ 2020 │ 2 │ 10 │ Animalia │ Chordata ⋯
│ (147.1, -37) │ missing │ missing │ missing │ Animalia │ Chordata ⋯
│ missing │ missing │ missing │ missing │ Animalia │ Chordata ⋯
│ missing │ missing │ missing │ missing │ Animalia │ Chordata ⋯
│ (148.329, -36.4317) │ 2016 │ 1 │ 3 │ Animalia │ Chordata ⋯
│ (148.347, -36.5047) │ 2012 │ 11 │ 22 │ Animalia │ Chordata ⋯
│ missing │ missing │ missing │ missing │ Animalia │ Chordata ⋯
│ missing │ missing │ missing │ missing │ Animalia │ Chordata ⋯
│ ⋮ │ ⋮ │ ⋮ │ ⋮ │ ⋮ │ ⋮ ⋱
└──────────────────────────┴─────────┴─────────┴─────────┴──────────┴───────────
78 columns and 285 rows omittedGet Bioclimatic variables
Get BioClim layers and subset to south-east Australia. The first time this is run, this will automatically download and save the files.
A = RasterStack(WorldClim{BioClim}, (1, 3, 7, 12))
se_aus = A[X(138 .. 155), Y(-40 .. -25), Band(1)]
┌ 101×90 RasterStack ┐
├────────────────────┴─────────────────────────────────────────────────── dims ┐
↓ X Projected{Float64} 138.16666666666666:0.16666666666666666:154.83333333333331 ForwardOrdered Regular Intervals{Start},
→ Y Projected{Float64} -25.166666666666668:-0.16666666666666666:-40.0 ReverseOrdered Regular Intervals{Start}
├────────────────────────────────────────────────────────────────────── layers ┤
:bio1 eltype: Union{Missing, Float32} dims: X, Y size: 101×90
:bio3 eltype: Union{Missing, Float32} dims: X, Y size: 101×90
:bio7 eltype: Union{Missing, Float32} dims: X, Y size: 101×90
:bio12 eltype: Union{Missing, Float32} dims: X, Y size: 101×90
├────────────────────────────────────────────────────────────────────── raster ┤
extent: Extent(X = (138.16666666666666, 154.99999999999997), Y = (-40.0, -25.0))
missingval: missing
crs: GEOGCS["WGS 84",DATUM["WGS_1984",SPHEROID["WGS 84",6378137,298.257223563,AUTHORITY["EPSG","7030"]],AUTHORITY["EPSG","6326"]],PRIMEM["Greenwich",0,AUTHORITY["EPSG","8901"]],UNIT["degree",0.0174532925199433,AUTHORITY["EPSG","9122"]],AXIS["Latitude",NORTH],AXIS["Longitude",EAST],AUTHORITY["EPSG","4326"]]
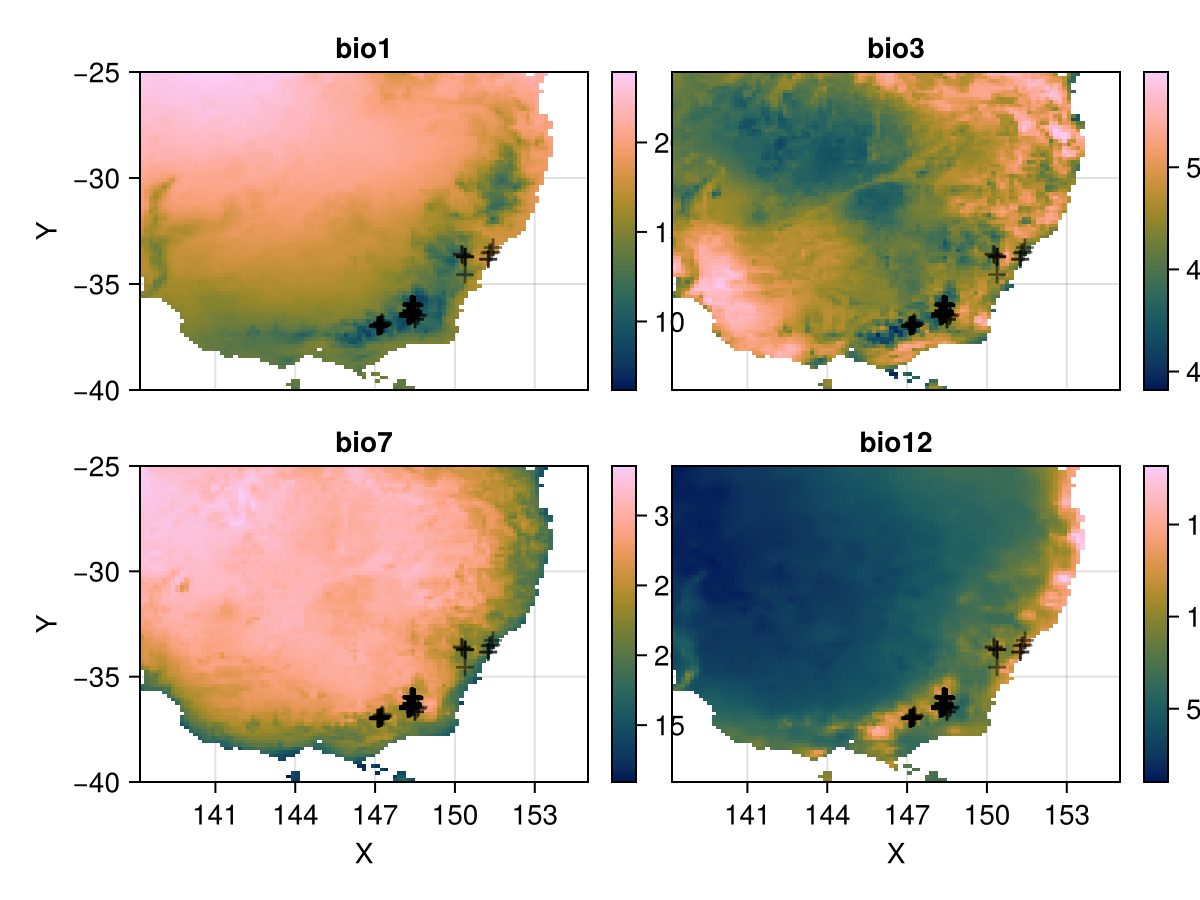
└──────────────────────────────────────────────────────────────────────────────┘Plot BioClim predictors and scatter occurrence points on all subplots
# The coordinates from the gbif table
coords = collect(skipmissing(records.geometry))

using CairoMakie
p = Rasters.rplot(se_aus);
for ax in p.content
    if ax isa Axis
        scatter!(ax, coords; alpha=0.5, marker='+', color=:black, markersize = 20)
    end
end
p
Extract bioclim variables at occurrence points
Then extract predictor variables and write to CSV. Use the skipmissing keyword to exclude both missing coordinates and coordinates with missing values in the RasterStack.
using CSV
presences = extract(se_aus, coords, skipmissing = true)
CSV.write("burramys_parvus_predictors.csv", presences)"burramys_parvus_predictors.csv"Or convert them to a DataFrame:
using DataFrames
df = DataFrame(presences)
df[1:5,:]
Sample background points
Next, sample random background points in the Raster. Rasters has a StatsBase extension to make this very straightforward. The syntax and output of Rasters.sample is very similar to that of extract.
using StatsBase
background = Rasters.sample(se_aus, 500, skipmissing = true)
500-element Vector{@NamedTuple{geometry::Tuple{Float64, Float64}, bio1::Float32, bio3::Float32, bio7::Float32, bio12::Float32}}:
(geometry = (150.99999999999997, -29.333333333333332), bio1 = 17.33198, bio3 = 50.774445, bio7 = 28.57425, bio12 = 773.0)
(geometry = (140.83333333333331, -31.0), bio1 = 20.18774, bio3 = 47.084934, bio7 = 31.523752, bio12 = 191.0)
(geometry = (152.49999999999997, -32.166666666666664), bio1 = 18.213871, bio3 = 50.137802, bio7 = 19.335526, bio12 = 1187.0)
(geometry = (141.83333333333331, -33.5), bio1 = 18.205688, bio3 = 49.03465, bio7 = 29.410751, bio12 = 270.0)
(geometry = (139.66666666666666, -26.333333333333332), bio1 = 23.23746, bio3 = 44.772575, bio7 = 32.168503, bio12 = 139.0)
(geometry = (151.66666666666666, -26.666666666666668), bio1 = 18.35926, bio3 = 51.1524, bio7 = 25.35825, bio12 = 766.0)
(geometry = (141.99999999999997, -34.5), bio1 = 17.289875, bio3 = 49.77683, bio7 = 28.639997, bio12 = 316.0)
(geometry = (147.66666666666666, -25.833333333333332), bio1 = 19.310947, bio3 = 48.89693, bio7 = 29.952501, bio12 = 581.0)
(geometry = (143.83333333333331, -36.0), bio1 = 15.870167, bio3 = 48.51501, bio7 = 27.91825, bio12 = 395.0)
(geometry = (148.99999999999997, -35.0), bio1 = 13.429239, bio3 = 47.2526, bio7 = 27.432749, bio12 = 725.0)
⋮
(geometry = (141.99999999999997, -37.0), bio1 = 14.266562, bio3 = 50.971245, bio7 = 25.77025, bio12 = 525.0)
(geometry = (148.33333333333331, -33.333333333333336), bio1 = 15.5385, bio3 = 42.91272, bio7 = 26.421751, bio12 = 670.0)
(geometry = (144.33333333333331, -28.333333333333332), bio1 = 21.451145, bio3 = 41.960613, bio7 = 29.66125, bio12 = 340.0)
(geometry = (148.16666666666666, -27.833333333333332), bio1 = 20.322407, bio3 = 47.638454, bio7 = 30.4735, bio12 = 520.0)
(geometry = (145.33333333333331, -38.333333333333336), bio1 = 14.366044, bio3 = 46.981476, bio7 = 20.393814, bio12 = 831.0)
(geometry = (147.33333333333331, -35.833333333333336), bio1 = 14.523948, bio3 = 46.739338, bio7 = 28.421501, bio12 = 767.0)
(geometry = (151.66666666666666, -25.666666666666668), bio1 = 20.972687, bio3 = 53.454006, bio7 = 25.24, bio12 = 768.0)
(geometry = (141.49999999999997, -38.5), bio1 = 13.763433, bio3 = 49.21192, bio7 = 15.658401, bio12 = 820.0)
(geometry = (145.66666666666666, -27.5), bio1 = 21.33623, bio3 = 44.971684, bio7 = 30.294249, bio12 = 382.0)Fit a statistical ensemble
In this example, we will SpeciesDistributionModels.jl to fit a statistical ensemble to the occurrence and background data.
First we need to load the models. SDM.jl integrates with MLJ - see the model browser for what models are available.
import Maxnet: MaxnetBinaryClassifier
import MLJGLMInterface: LinearBinaryClassifier
# define the models in the ensemble
models = (
    maxnet = MaxnetBinaryClassifier(),
    maxnet2 = MaxnetBinaryClassifier(features = "lq"),
    glm = LinearBinaryClassifier()
)
(maxnet = Maxnet.MaxnetBinaryClassifier("", 1.0, Maxnet.default_regularization, true, 50, 100.0, GLM.CloglogLink(), false, Base.Pairs{Symbol, Union{}, Tuple{}, @NamedTuple{}}()), maxnet2 = Maxnet.MaxnetBinaryClassifier("lq", 1.0, Maxnet.default_regularization, true, 50, 100.0, GLM.CloglogLink(), false, Base.Pairs{Symbol, Union{}, Tuple{}, @NamedTuple{}}()), glm = MLJGLMInterface.LinearBinaryClassifier(true, GLM.LogitLink(), nothing, 30, 1.0e-6, 1.0e-6, 0.001, [:deviance, :dof_residual, :stderror, :vcov, :coef_table]))Next, format the data using sdmdata. To test how rigurous our models are, we will use 3-fold cross-validation.
using SpeciesDistributionModels
const SDM = SpeciesDistributionModels
data = sdmdata(presences, background; resampler = CV(; nfolds = 3))
SDMdata object with 253 presence points and 500 absence points.
Resampling:
Data is divided into 3 folds using resampling strategy CV(nfolds = 3, …).
┌──────┬─────────┬────────┐
│ fold │ # train │ # test │
├──────┼─────────┼────────┤
│ 1 │ 502 │ 251 │
│ 2 │ 502 │ 251 │
│ 3 │ 502 │ 251 │
└──────┴─────────┴────────┘
Predictor variables:
┌───────┬────────────┬─────────┐
│ names │ scitypes │ types │
├───────┼────────────┼─────────┤
│ bio1 │ Continuous │ Float32 │
│ bio3 │ Continuous │ Float32 │
│ bio7 │ Continuous │ Float32 │
│ bio12 │ Continuous │ Float32 │
└───────┴────────────┴─────────┘
Also contains geometry dataNow, fit the ensemble, passing the data object and the NamedTuple of models!
ensemble = sdm(data, models)trained SDMensemble, containing 9 SDMmachines across 3 SDMgroups
Uses the following models:
maxnet => MaxnetBinaryClassifier.
maxnet2 => MaxnetBinaryClassifier.
glm => LinearBinaryClassifier.Use SDM.jl's evaluate function to see how this ensemble performs.
SDM.evaluate(ensemble)SpeciesDistributionModels.SDMensembleEvaluation with 4 performance measures
train
┌──────────┬──────────┬──────────┬──────────┬──────────┐
│ model │ accuracy │ auc │ log_loss │ kappa │
│ Any │ Float64 │ Float64 │ Float64 │ Float64 │
├──────────┼──────────┼──────────┼──────────┼──────────┤
│ maxnet │ 0.978088 │ 0.997412 │ 0.19054 │ 0.950664 │
│ maxnet2 │ 0.97676 │ 0.996546 │ 0.19725 │ 0.947292 │
│ glm │ 0.977424 │ 0.997031 │ 0.068339 │ 0.949162 │
│ ensemble │ 0.978088 │ 0.997139 │ 0.126524 │ 0.950664 │
└──────────┴──────────┴──────────┴──────────┴──────────┘
test
┌──────────┬──────────┬──────────┬───────────┬──────────┐
│ model │ accuracy │ auc │ log_loss │ kappa │
│ Any │ Float64 │ Float64 │ Float64 │ Float64 │
├──────────┼──────────┼──────────┼───────────┼──────────┤
│ maxnet │ 0.977424 │ 0.996483 │ 0.200533 │ 0.949313 │
│ maxnet2 │ 0.977424 │ 0.996453 │ 0.205159 │ 0.949095 │
│ glm │ 0.977424 │ 0.996938 │ 0.0780288 │ 0.949009 │
│ ensemble │ 0.977424 │ 0.996842 │ 0.134512 │ 0.9489 │
└──────────┴──────────┴──────────┴───────────┴──────────┘Not too bad!
Make predictions of climatic suitability
Use the ensemble to
suitability = SDM.predict(ensemble, se_aus, reducer = mean)┌ 101×90 Raster{Union{Missing, Float64}, 2} ┐
├───────────────────────────────────────────┴──────────────────────────── dims ┐
↓ X Projected{Float64} 138.16666666666666:0.16666666666666666:154.83333333333331 ForwardOrdered Regular Intervals{Start},
→ Y Projected{Float64} -25.166666666666668:-0.16666666666666666:-40.0 ReverseOrdered Regular Intervals{Start}
├────────────────────────────────────────────────────────────────────── raster ┤
extent: Extent(X = (138.16666666666666, 154.99999999999997), Y = (-40.0, -25.0))
missingval: missing
crs: GEOGCS["WGS 84",DATUM["WGS_1984",SPHEROID["WGS 84",6378137,298.257223563,AUTHORITY["EPSG","7030"]],AUTHORITY["EPSG","6326"]],PRIMEM["Greenwich",0,AUTHORITY["EPSG","8901"]],UNIT["degree",0.0174532925199433,AUTHORITY["EPSG","9122"]],AXIS["Latitude",NORTH],AXIS["Longitude",EAST],AUTHORITY["EPSG","4326"]]
└──────────────────────────────────────────────────────────────────────────────┘
↓ → -25.1667 -25.3333 … -39.6667 -39.8333 -40.0
138.167 5.56749e-7 5.81406e-7 missing missing missing
138.333 6.12243e-7 6.23061e-7 missing missing missing
138.5 8.13018e-7 9.02255e-7 missing missing missing
138.667 8.66876e-7 1.17584e-6 missing missing missing
⋮ ⋱ ⋮
154.167 missing missing missing missing missing
154.333 missing missing missing missing missing
154.5 missing missing missing missing missing
154.667 missing missing … missing missing missing
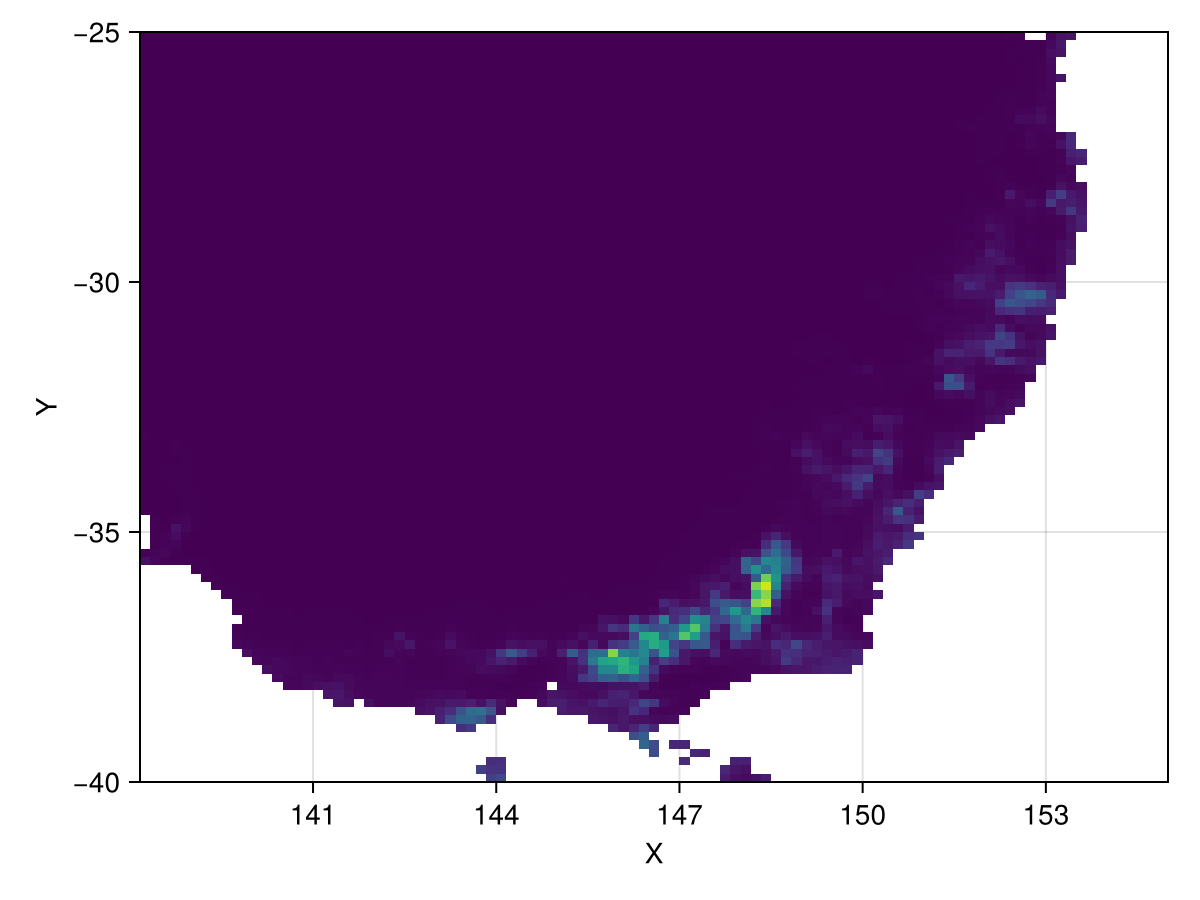
154.833 missing missing missing missing missingAnd let's see what that looks like
plot(suitability, colorrange = (0,1))
